What is Max Stat? The Top Skilled Skaters of the 2025-2026 Season
- James Finch

- May 7
- 6 min read
If you’ve been following us for the past year or two, you may have seen Max Stat on our contract projection graphics, or maybe even some social media posts containing the Max Stat graphic itself. You deserve a little more of a breakdown into what it contains, and more so what it means. What better way to dive into it than in reflection of the most skilled skaters of the 2025-2026 season?
First things first (and we’ll be quick): Max Stat is only available through subscription. While we have our free contract projections coming soon this offseason, we’ve found that having a website with an interactive experience for our followers also has a cost to it. While our projections will stay free, some of our other content (Max Stat tables and graphics and extra contract content like graphics, tax impact and comps) has been placed within the subscription. Our subscription options are monthly ($3) and annual ($28.80, a 20% discount on 12 individual months).
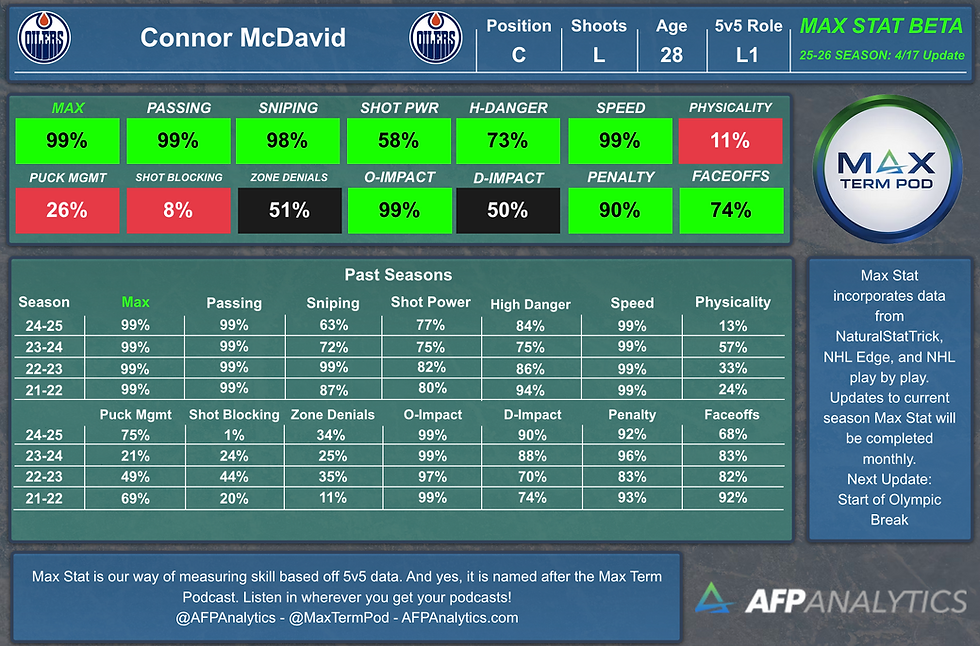
Alright, now let’s get to it. To be clear, Max Stat is not a WAR stat. We’ve identified a couple handfuls of different abilities and skills that we felt we could quantify through 5v5 statistics. Each of these skills combines into the Max Stat to help give an idea of who the most skilled NHL players are. At the same time, it can be very useful if you are looking to see just how good a player's shot is (or isn’t), or maybe to identify a speedy or physical player for your team to acquire at the deadline. Only skaters with 200 minutes of ice time at 5v5 on the season qualify for Max Stat. As of now, we still have Max Stat in beta form as we may tinker with weights of certain stats after further analysis.
We’ll look at each individual skill ranking first and conclude with the Max Stat. Along with a short explanation of each skill stat, we’ll provide the top 3 2025-2026 forwards and defensemen for each skill, as well as the best and worst team for each skill. It is important to note that the skills of forwards and defensemen are scaled and ranked separately, meaning a certain score/percentage for a defenseman is not necessarily comparable to that of a forward.
Passing: Using both assists and on-ice shots not taken by the player, we can approximate an individual player's ability to set up shots and ultimately goals.
Top 3 F: Nathan MacKinnon (COL, 3.31, 99%), Mark Scheifele (WPG, 3.21, 99%), Connor McDavid (EDM, 2.96, 99%)
Top 3 D: Evan Bouchard (EDM, 3.04, 99%), Rasmus Dahlin (BUF, 2.90, 99%), Zach Werenski (CBJ, 2.70, 99%)
Best Team: Colorado Avalanche
Worst Team: Florida Panthers

Sniping: A player's ability to convert on long range shots. The idea here is to eliminate close to the net chances and strictly look at a player's sniping ability.
Top 3 F: Mark Scheifele (WPG, 5.56, 99%), Nathan MacKinnon (COL, 5.14, 99%), Morgan Geekie (BOS, 4.42, 99%)
Top 3 D: Jakob Chychrun (WSH, 5.20, 99%), Darren Raddysh (TBL, 4.74, 99%), Matthew Schaefer (NYI, 3.71, 99%)
Best Team: Colorado Avalanche
Worst Team: Calgary Flames

Shot Power: Combining NHL Edge shot speed ranges (100+ MPH, 90-100 MPH, 80-90 MPH, and 70-80 MPH) for each player, weighted in favor of the higher ranges within the calculation.
Top 3 F: Tage Thompson (BUF, 6.53, 99%), Alex Ovechkin (WSH, 4.78, 99%), Adrian Kempe (LAK, 4.29, 99%)
Top 3 D: Darren Raddysh (TBL, 5.32, 99%), Evan Bouchard (EDM, 3.75, 99%), Cale Makar (COL, 3.26, 99%)
Best Team: Colorado Avalanche
Worst Team: Dallas Stars

High Danger: An individual's high danger (close proximity to the net) chances for, while factoring in ice time.
Top 3 F: Zach Hyman (EDM, 4.06, 99%), Anders Lee (NYI, 3.78, 99%), Matthew Tkachuk (FLA, 2.95, 99%)
Top 3 D: Theo Lindstein (STL, 3.76, 99%), Ian Moore (ANA, 3.29, 99%), Rasmus Dahlin (BUF, 2.85, 99%)
Best Team: Colorado Avalanche
Worst Team: Chicago Blackhawks

Speed: Combining NHL Edge skating speed burst ranges (22+ MPH/G, 20+ MPH/G, 18+ MPH/G) for each player, weighted in favor of the higher ranges within the calculation.
Top 3 F: Connor McDavid (EDM, 6.81, 99%), Martin Necas (COL, 3.87, 99%), Nathan MacKinnon (COL, 3.83, 99%)
Top 3 D: Matthew Schaefer (NYI, 4.81, 99%), Jake Sanderson (OTT, 4.60, 99%), Cale Makar (COL, 3.74, 99%)
Best Team: Colorado Avalanche
Worst Team: Calgary Flames
Physicality: Both hits/60 and hits taken/60 factor in here, heavily weighted towards hits the player made on others.
Top 3 F: Jacob Melanson (SEA, 5.13, 99%), Nicolas Deslauriers (PHI/CAR, 3.74, 99%), Yakov Trenin (MIN, 3.38, 99%)
Top 3 D: Arber Xhekaj (MTL, 4.19, 99%), Luke Schenn (WPG/BUF, 4.02, 99%), Jeremy Lauzon (VGK, 3.84, 99%)
Best Team: Minnesota Wild
Worst Team: Chicago Blackhawks

Puck Management: Takeaways vs giveaways. If you have a lot more takeaways than giveaways, you are doing well with this one!
Top 3 F: Jaroslav Chmelar (NYR, 7.30, 99%), Brendan Gaunce (CBJ, 5.43, 99%), Justin Hryckowian (DAL, 5.07, 99%)
Top 3 D: Jaccob Slavin (CAR, 5.40, 99%), Cole Hutson (WSH, 3.20, 99%), Brett Pesce (NJD, 3.06, 99%)
Best Team: New York Rangers
Worst Team: Utah Mammoth

Shot Blocking: Shots blocked by an individual player, while factoring in how much ice time a player is deployed away from the defensive zone (where they are likely to rack up blocked shots!).
Top 3 F: Adam Henrique (EDM, 4.21, 99%), Elias Pettersson (VAN, 4.05, 99%), Tyler Pitlick (MIN, 3.27, 99%)
Top 3 D: Brandt Clarke (LAK, 2.66, 99%), Daemon Hunt (MIN, 2.63, 99%), Ryan Graves (PIT, 2.27, 99%)
Best Team: Minnesota Wild
Worst Team: Carolina Hurricanes

Zone Denials: Hits and takeaways within close proximity to the defensive blueline.
Top 3 F: Jacob Melanson (SEA, 6.45, 99%)), Yakov Trenin (MIN, 5.58, 99%), Scott Sabourin (TBL, 5.11, 99%)
Top 3 D: Colton White (NJD, 4.47, 99%), Jack St. Ivany (PIT, 4.11, 99%), Arber Xhekaj (MTL, 4.10, 99%)
Best Team: New York Rangers
Worst Team: St. Louis Blues

O-Impact: Determines how efficiently the team is generating offense when a player is on ice compared to time spent outside the offensive zone. The time spent outside the offensive zone is scaled relative to team strength and deployment. Basically, a player with good offensive metrics who is heavily deployed in the offensive zone will not score as well as a player with the same offensive metrics who is heavily deployed outside of the offensive zone.
Top 3 F: Brandon Hagel (TBL, 3.16, 99%), Zach Hyman (EDM, 3.15, 99%), Connor McDavid (EDM, 2.89, 99%)
Top 3 D: Mattias Ekholm (EDM, 3.13, 99%), Joel Nystrom (CAR, 2.82, 99%), Mike Rielly (CAR, 2.78, 99%)
Best Team: Carolina Hurricanes
Worst Team: Toronto Maple Leafs

D-Impact: Determines how efficiently the team is defending (not giving up chances) when a player is on ice compared to time spent outside the defensive zone. The time spent outside the defensive zone is scaled relative to team strength and deployment. Basically, a player with good defensive metrics who is heavily deployed outside of the defensive zone will not score as well as a player with the same defensive metrics who is heavily deployed within the defensive zone.
Top 3 F: William Carrier (CAR, 3.38, 99%), Josh Samanski (EDM, 3.07, 99%), Danton Heinen (PIT/CBJ, 3.03, 99%)
Top 3 D: Jordan Spence (OTT, 3.08, 99%), Adam Fox (NYR, 2.46, 99%), Jake Bean (CGY, 2.41, 99%)
Best Team: Dallas Stars
Worst Team: Toronto Maple Leafs

Penalty Differential: An individual player's ability to draw more penalties than they commit.
Top 3 F: Rutger McGroarty (PIT, 7.18, 99%), Liam Ohgren (MIN/VAN, 6.10, 99%), Emmitt Finnie (DET, 5.74, 99%)
Top 3 D: Nick Blankenburg (NSH/COL, 4.41, 99%), Olli Maatta (UTAH/CGY, 4.41, 99%), Philip Broberg (STL, 3.77, 99%)
Best Team: Detroit Red Wings
Worst Team: Nashville Predators

Faceoffs: Faceoff percentage of each player, ranked across the league. Players need 40+ attempts to qualify and not receive a 0 score.
Top 3 F: Curtis Lazar (EDM, 1.52, 99%), Jonathan Toews (WPG, 1.47, 99%), Mark Kastelic (BOS, 1.46, 99%)
Best Team: Edmonton Oilers
Worst Team: Seattle Kraken

Max Stat: All skill stats are combined. Skills like sniping, passing, and speed receive a heavier weight than skills like penalty differential and puck management. The importance of each skill differs between forwards and defensemen, leading to a slightly different weighting system for both position groups.
Top 3 F: Nathan MacKinnon (COL, 37.13, 99%), Connor McDavid (EDM, 33.98, 99%), Mark Scheifele (WPG, 24.46, 99%)
Top 3 D: Cale Makar (COL, 24.78, 99%), Jake Sanderson (OTT, 21.73, 99%), Matthew Schaefer (NYI, 20.25, 99%)
Best Team: Colorado Avalanche
Worst Team: Chicago Blackhawks

Ranking of all the teams for each stat? Here you go:

Max Stat incorporates data from NaturalStatTrick.com, NHL Edge, and NHL play by play data.


Comments